Modeling March Madness — Part One (By Corey Berg)
the following is the first of a few posts about modeling the 2014 ncaa men’s basketball tournament. my friend Corey Berg has built a model that we’ll be using to inform our bracket building, and he wrote a little about the process. enjoy!
I’ve been obsessed with the NCAA tournament from a young age. I still remember getting sick on the first Thursday back in elementary school one year and thinking it was the greatest thing that could have ever happened to me. I also remember faking sick the next year in a pathetic effort to recapture the glory that had been watching games in bed, home from school. I only tell you this to set the stage for what (I think) has been a very successful and interesting project to-date.
I decided to apply the limited modeling and data-basing knowledge I have to try to model win probabilities based on various efficiency factors. These factors have been well-established by the greatest analytic minds in basketball (Ken Pomeroy, Dean Oliver, etc.) and do a great job of normalizing for a team’s style of play. They only care about whether a team is efficient in the way it operates on both the offensive and defensive end. Efficiency in basketball (and in essentially every facet of life) is central to future success.
These four factors are defined below:
- Effective FG% = (0.5*3PT_FGM + FGM)/FGA
- TO% = TO/Possessions
- Offensive Rebounding % = OR/(OR + DR_opponent)
- Free Throw Rate = FTM/FGA (debate about whether to use FTM or FTA, I will explain later)
Please note that possessions are not tracked officially by the NCAA and can be reasonably estimated by:
Possessions = FGA – OR + TO + 0.4*FTA
I credit both: http://www.rawbw.com/~deano/articles/20040601_roboscout.htm and http://kenpom.com/blog/index.php/weblog/four_factors/ for this knowledge/background.
On to the fun stuff:
The modeling dataset I used consisted of roughly 5,000 games (games from the 2013 season, January 1st to mid-March). For each game, I tracked the four factors for each team and its opponent and used logistic regression (with a constrained intercept of 0, since there it would be nonsensical to assume a team had more or less than a 50% chance of winning in the absence of any information). I split the modeling data set into 3 buckets:
- Training set
- Test set – same time-period as training set, but less data
- Validate set – out-of-time sample to confirm that we are not overfitting by including all factors
Below are the results:

Looking at univariates (actual vs. predicted) for all four factors on the validate set demonstrates a reasonably constructed model:
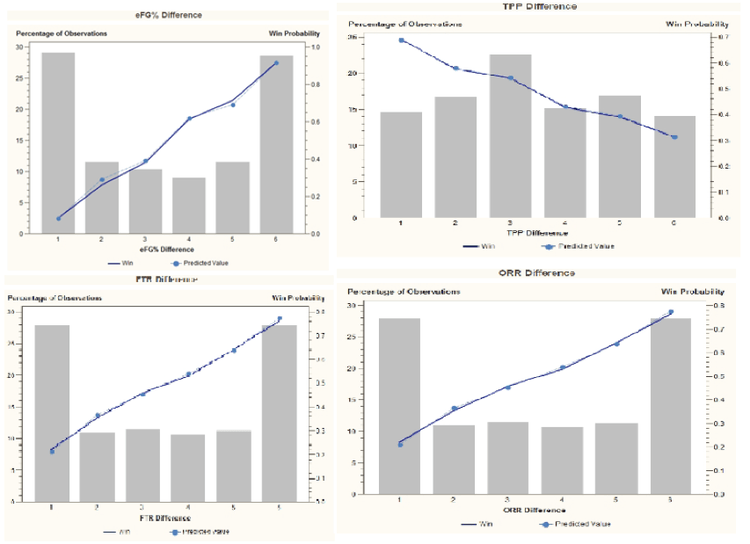
The results were in agreement with results of Ken Pomeroy and Dean Oliver stating that, the importance of the four factors is clearly spelled out: eFG% and turning the ball over less than your opponent are much more important than rebounding or getting to the free throw line, but all four certainly matter.
Now that we have a model, my next big question was: ok, so how would I apply these results in a game-by-game context? After all, the goal of this project was to develop a model that would be predictive on a game-by-game basis. What inputs should I use given the following information:
- A team and its four factors (really 8 — 4 for both offense and defense)
- A team’s opponents and its four factors (again, really 8 – 4 for both offense and defense)
I decided that, in the absence of more information/research, the simplest thing to do would be to use the following for inputs:
- Team_eFG% = 0.5*Team_OFF_eFG% + 0.5*Team_opponent_DEF_eFG%
- Team_TPP% = 0.5*Team_OFF_TPP% + 0.5*Team_opponent_DEF_TPP%
- Team_ORR% = 0.5*Team_OFF_ORR% + 0.5*Team_opponent_DEF_ORR%
- Team_FTR% = Team_FT%*[0.5*Team_OFF_FTR% + 0.5*Team_opponent_DEF_FTR%]
Basically, the essence of the first 3 bullet points above is that the best estimate of how a team will perform is the average of how it usually performs and how its opponent usually allows other teams to perform. The exception is in the last bullet point, since free throws are shot without any defensive interaction. So for that, we first consider how often a team gets to the free throw line and how often a team’s opponent allows other teams to get to the free throw line. Then, we multiply that rate by how a team usually converts its opportunities at the free throw line. That gets us to a FTM/FGA estimate, which is what was used in the model.
I hope you all will forgive the bad notation, but hopefully everyone is still following. Now that I had a method of selecting inputs, I figured that a natural next step would be to test the model on some upcoming games – what better than the upcoming major conference tournaments?
Turns out it did pretty well – while I didn’t really consider it in the context of filling out a bracket ahead of the tournaments, it did great on a game-by-game basis (I simply input a team and it’s opponent at the start of each day’s games). See below for summary of results:
- 52/73 (71%) of games correctly predicted (i.e. team had estimated win probability of more than 50%)
- Of the 21 of games that the model incorrectly predicted, 14 (67%) had a margin of victory of 5 or fewer points
- All 10 games where the winner had an estimated win probability of more than 75% were decided by 7 or fewer points
- Correctly predicted 8 lower seed winners; incorrectly predicted 7 lower seed winners
These results were fantastic, in my humble opinion. Obviously, it’s not going to get 100% of the games right, but the games that it got wrong can be pretty easily grouped into the following buckets:
- Close matchups where the winner was given a win probability of less than 75% in the first place
- Big upsets that were decided by a very close margin where the favorite either significantly underperformed its season averages (see Iowa losing to Northwestern and Villanova losing to Seton Hall) or the inputs could have been improved by using the last 10 games (see Iowa, who has not been playing efficient defense for the last month or so and let that show by allowing Northwestern to shoot very efficiently from the 3-pt line)
Bottom line: I think the model is pretty sound, but should be considered as an additional source of information and not necessarily sole predictor of games in the NCAA tournament. More to come on that.
Please e-mail me at cgberg128@gmail.com with any questions or comments. Thanks!
note: if you’ve made it this far and you’re hungry for more basketball modeling, check out this post i wrote last year about modeling nba games.
