Modeling the 2014-15 NBA Season (Part One)
Well, the 2014-15 NBA season is right around the corner. Being an eternal optimist, I’m eagerly awaiting what is sure to be a phenomenal season for my Denver Nuggets!
Ok, you’re right, I’m not anything like an eternal optimist…I’m barely a part-time optimist. But I am pretty excited for this season. There’s no way it can be any worse than last year’s 36-46 record. A tumultuous offseasonhad me pessimistic going into the season, and I predicted that they’d miss the playoffs for the first time since 2002-03. An unusually injury-ridden year ensued, and the team did even worse than I anticipated.
But there was some room for optimism: Mozgov and Faried both had breakout years, particularly towards the end of the season, and Lawson continued to develop as a leader. Brian Shaw even seemed to find his rhythm later in the year. And the front office made the team leaps and bounds better this offseason by trading for Aaron Afflalo and drafting Gary Harris and Jusuf Nurkic.
I was eager to quantify the value of these offseason moves in an attempt to predict how well the Nuggets would be in the upcoming year. I immediately ran into the challenge of attempting to predict how a team would perform when its composition is so drastically different from the prior year. It’s likely that three of the team’s starters will be different this year (Foye, Chandler, and Mozgov are likely to be replaced by Afflalo, Gallinari, and McGee…although who knows what’ll happen in at center this year). To solve this quandary, I set out on a quest to update my model from last year.
I’m going to keep the method for this new model under wraps for now (one part trade secrets and two parts avoiding over-promising), but my hope is to have a refreshed model up and running before the team opens the season on October 29. I’ll be posting updates periodically so be sure to check in often!
In the meantime, I thought I’d share some early investigations and rough approximations for how the team’s composition will differ next year. First, let’s take a look at how each player on the roster last year performed:
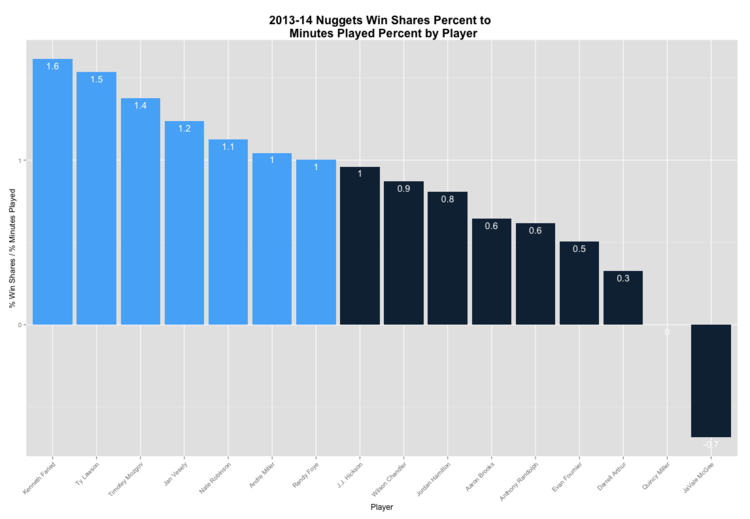
The metric I’m using here is based on Win Shares and is adjusted for playing time. Usually this is done by calculating Win Shares per 48 minutes, but this sort of calculation is problematic when comparing players on different teams (as we’ll be doing shortly…). Since the amount of Win Shares a player can receive is so closely tied to how many games his team won, it’s difficult to compare a player on an awful team with a player on a great team. To illustrate this, let’s take a look at Lawson’s Win Shares per 48 minutes over the course of his career:
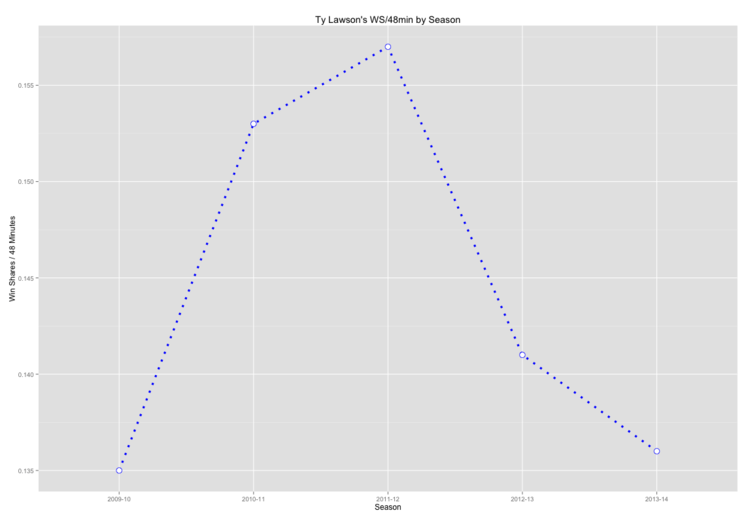
In my opinion, Lawson had one of the best seasons of his career last year, but his Win Shares per 48 minutes is pretty bad largely due to the fact that the Nuggets only won 36 games last year. Another way of explaining this issue is that Win Shares per 48 minutes standardizes for minutes played, but not for quality of teammates. By looking a percentage of his team’s Win Shares compared to a percentage of his team’s minutes, we’re better able to identify a player’s value to his team, regardless of how successful his team was. If a player was completely average, we’d expect him to produce Win Shares in equal proportion to the amount of time he plays. In other words, if he played 15% of his team’s minutes, we’d expect him to contribute 15% of his team’s Win Shares. So, an average player’s % Win Shares / % Minutes Played would be 1.
Ignoring the Jan Vesely outlier (he hardly played, and when he did it was mostly in garbage time), the Nuggets really only had three players that played disproportionately well last year: Faried, Lawson, and Mozgov. Amusingly, Randy Foye was about as perfectly average as could possibly be. Since Foye and Evan Fournier’s minutes will be largely replaced by Aaron Afflalo and Gary Harris, it’s natural to want to compare these players. I’m not going to get into trying to deal with Gary Harris (college to pro comparisons would require much more investigation than I’m willing to do right now), but our new metric allows us to reasonably compare Afflalo with Foye/Fournier. Taking Foye’s 1.0 and Fournier’s 0.5 out of the equation and adding in Afflalo’s 1.5 with the Magic last year, we get this:
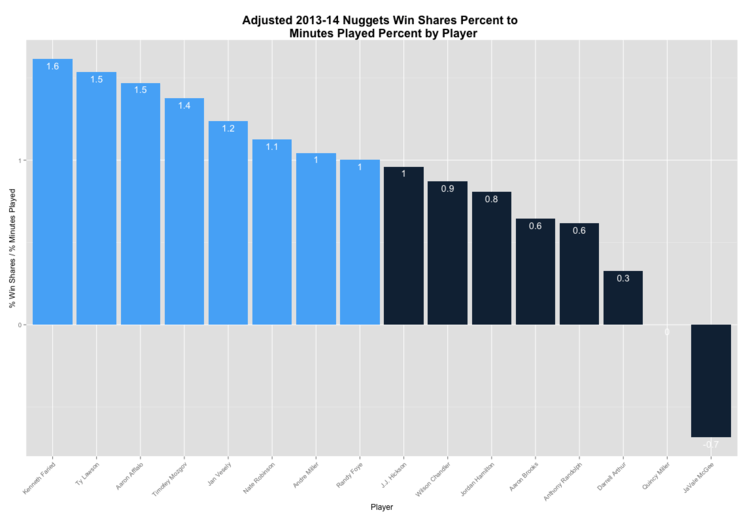
It’s hard to know if Afflalo’s actual % Win Shares / % Minutes PLayed next year will be as great as it was last year…in addition to year-over-year fluctuations, his role on this team will likely be very different than his role on the Magic. With the Magic, he had the opportunity to generate a disproportionate amount of Win Shares due to the fact that his teammates were so miserable. He’ll likely have less opportunities this year, so I’d expect his value next year to drift a little lower. Still, though, it’ll likely be better than Foye’s 1.0 and it’ll certainly be much better than Fournier’s 0.5.
If we remove Andre Miller, Jan Vesely, Jordan Hamilton, Aaron Brooks, and Anthony Randolph, who have all found new homes, and factor Gallo and JaVale McGee (who was hurt for virtually all of last year) back into the equation (using their values from the 2012-13 season) the team now looks like this:
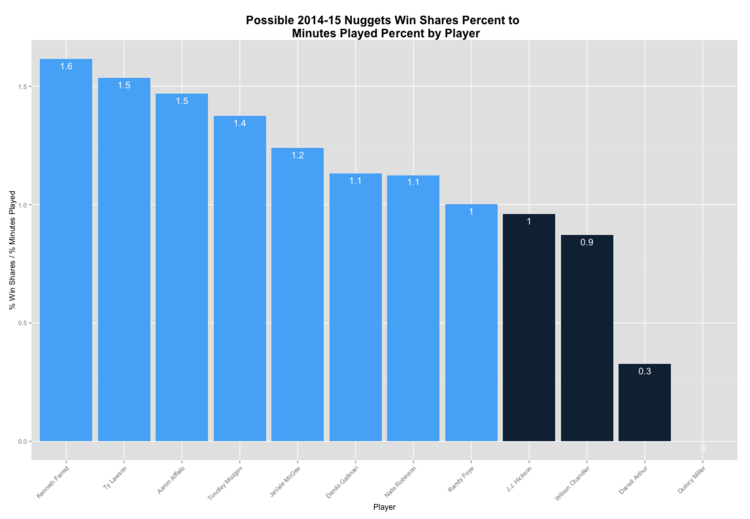 Now that looks much prettier, doesn’t it? Obviously there are a lot of unknowns (how the rookies will play, how the new team will gel, injuries, etc.), and obviously not everybody can be generating disproportionate amounts of Win Shares, so the actual results will be much less baby-blue. But this simple exercise does do a decent job of showing that the Nuggets have improved tremendously over last year. More to come on just how much they’ve improved…
